
Case Study: Design sprint, Finding Data by Location
The Office for National Statistics is the UK’s largest independent producer of official statistics and its recognised national statistical institute. It is responsible for collecting and publishing statistics related to the economy, population and society at national, regional and local levels. It also conducts the census in England and Wales every 10 years.
ONS has been releasing statistics as large files containing all the available data. User feedback has suggested that users are often looking for subsets of that data, but often, the subset they want is unique to that user.
The ONS publishing team needed support to design a feature which could provide this flexibility to users clearly.
Method
During my career in Service and UX design, I-as many other design thinkers often turn to five day design sprints. (It was invented by a team at Google Ventures. If you’re interested in learning more, I recommend you read Sprint by Jake Knapp.)
The purpose of a Google Design Sprint is to help organisations answer critical business questions by:
• Ideating and validating new business ideas
• Designing, prototyping, and testing solutions
• Seeing finished products and customer reactions before making expensive commitments
The point of a design sprint is to “solve big problems and test new ideas in just five days”. Our big problem was geography. We have a clear user need: “as an information forager, I need to find data by geographic area, so that I can help my colleagues learn about a specific location”. It comes up time and again in all our research.
The point of a design sprint is to “solve big problems and test new ideas in just five days”. Our big problem was geography. We have a clear user need: “as an information forager, I need to find data by geographic area, so that I can help my colleagues learn about a specific location”. It comes up time and again in all our research.
The issue of geography kept coming up in our retrospectives too. Statistical geography is a particularly complex topic. It isn’t straightforward to align that complexity with the simple user need.
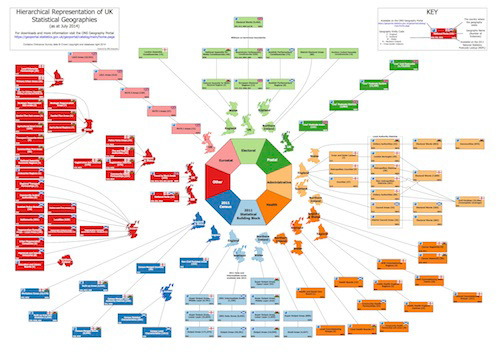
Hierarchical Diagram of UK Statistical Geographies
Monday: understanding the problem
The first day was about figuring out what we wanted to achieve. It’s about identifying the biggest risks. Prioritising the problems that we wanted to tackle. Everybody had the opportunity to put forward ideas by writing them down and sticking them up on the wall. Then we grouped the ideas together and voted.
Our priorities were:
• taxonomy navigation (How will users navigate through the site? This is a brand new way to find things.)
• area landing page (We needed a new type of page on the site that could contain information about an area)
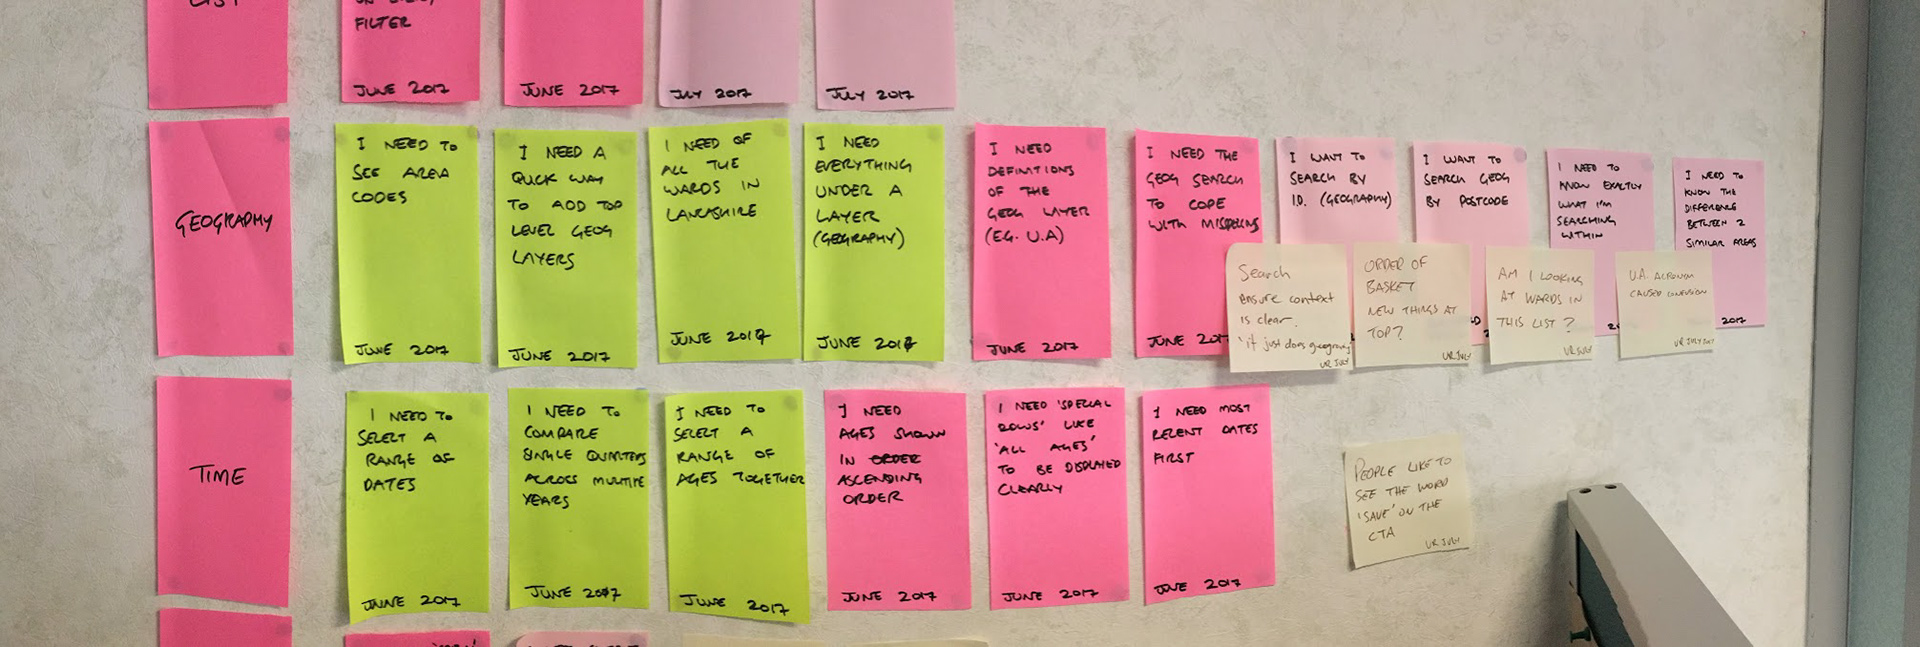
A user needs map showing finding from engagement with users and stakeholders
Tuesday: explore similar services
The second day is about looking at similar services. What can we learn about other websites that handle geography? We tried to look at services outside of government, and keep an open mind about design approaches.
We looked at:
Wednesday: refining our ideas
On the third day, we listed out everything we needed on each page for the user to complete their journey. Then we made a detailed sketch for each screen. This gave us a storyboard to build and test against.
We designed a user journey that allowed people to navigate from a high-level location (for example, United Kingdom). Then navigate down to the area they need (for example, Southampton).
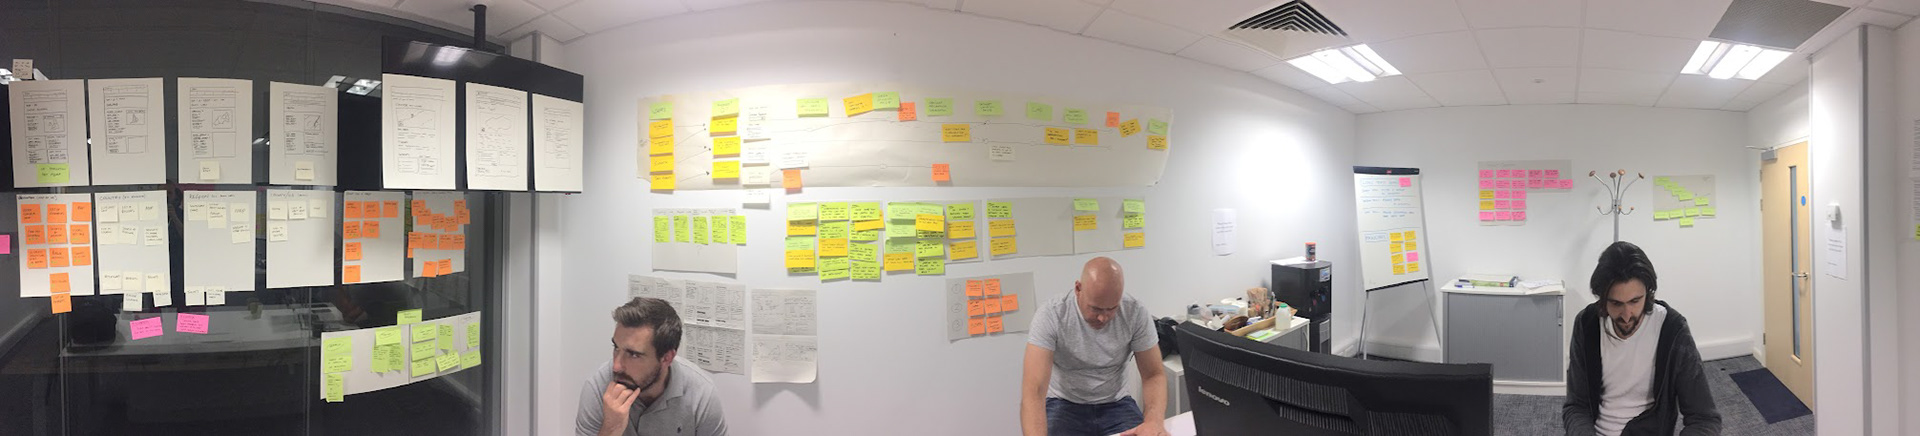
An photograph of the workspace from the design sprint
Thursday: making a prototype
On the fourth day, we made the prototype. Having one day was a bit scary. But because we’d spent three days planning, we could have some confidence in our decisions. We didn’t need to debate the details.
We decided to build the prototype in code. It allowed us to build something quickly, by reusing the existing website styles. We could focus on the user journey, not the small details. It gave us a prototype that was easy to test with external users and iterate on in the future.
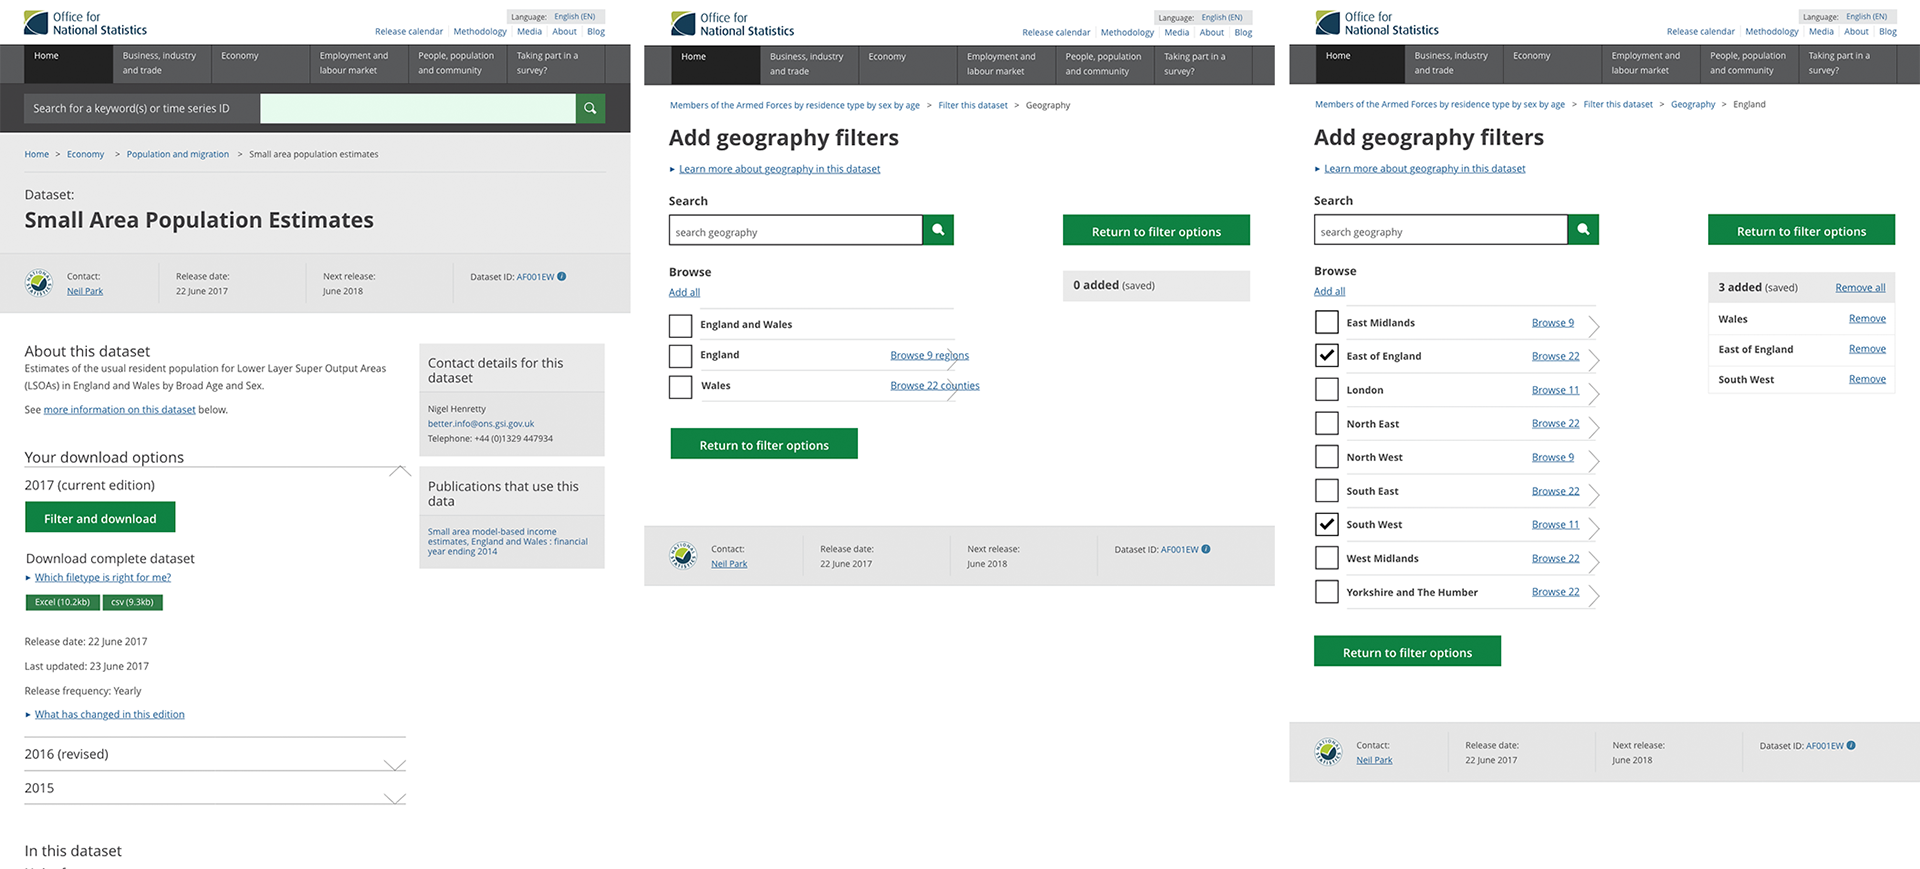
Wireframe that show the journey to customising data
Friday: testing with users
On the last day, we tested our prototype with users. Due to the short turnaround, we were only able to recruit internal users. This is not ideal, but it allowed it us to iron out any major usability issues. We where able to find 11 participants. Each with different awareness of statistical geographies.
The prototype
Here is a link to the prototype we created: Prototype 1.
Following our first round of usability testing, we created a second iteration. We tested this follow-up with “real users” in Southampton: Prototype 2.
NOTE: This is a simple prototype. It only allows a single journey to find “crime and justice data in Southampton”.
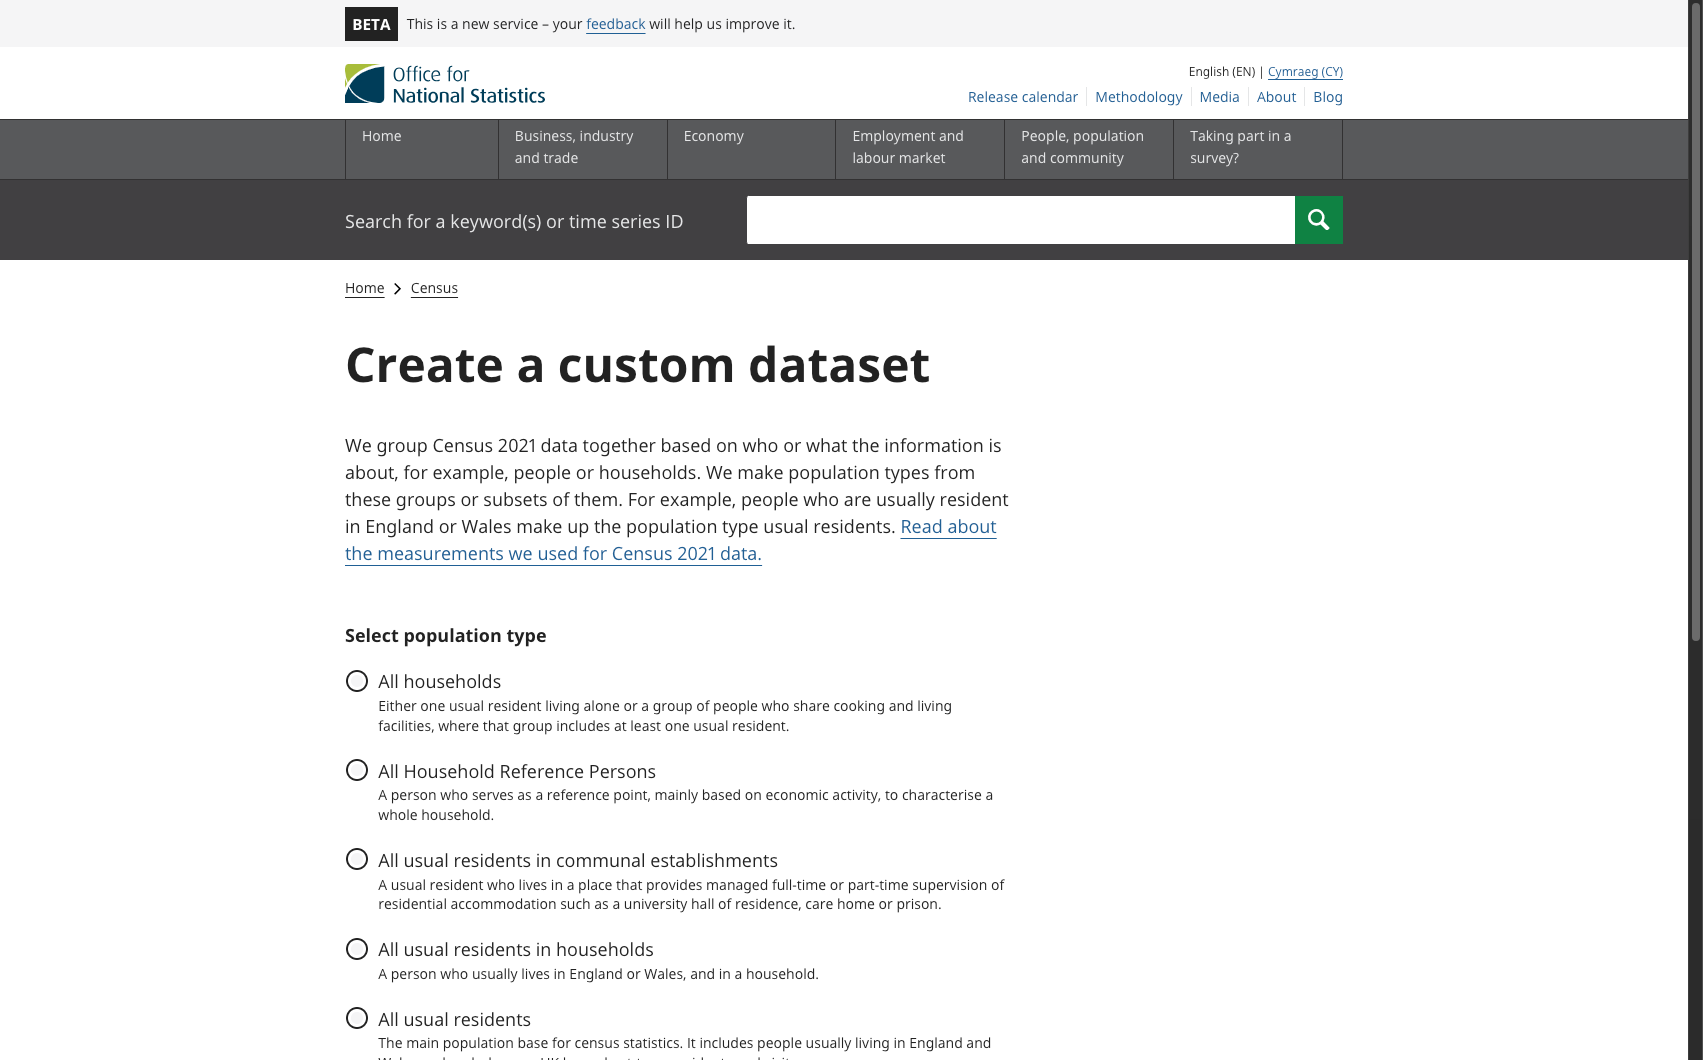
Custom dataset are now widely available throughout the ONS website
Outcome
The design sprint led to the creation of a feature that now allows users to search for and access custom datasets based on geography across the ONS website. The new functionality ensures that users can easily navigate from high-level regions to specific areas, finding the exact data they need without sifting through overwhelming amounts of information.
By adopting the Google Design Sprint methodology, we were able to rapidly ideate, prototype, and test a solution that met user needs and addressed the complexities of statistical geography in a user-friendly way.
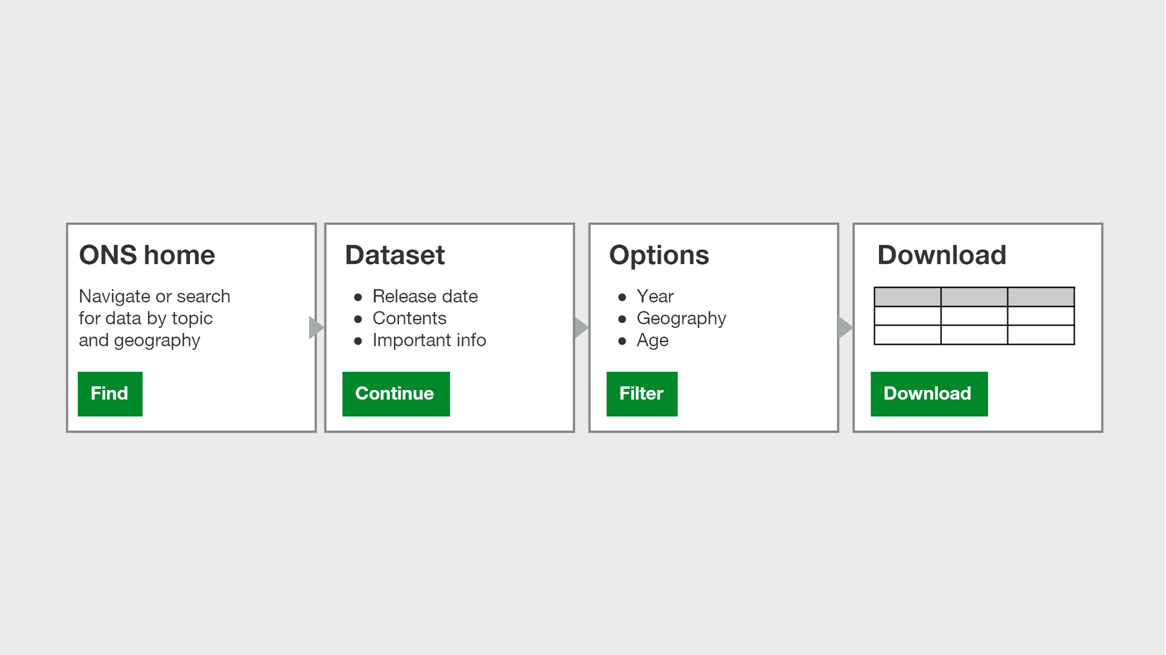
High level flows of navigation through the ONS website to customise and download data